LPS students perform well on first online Math and English Language Arts CMAS tests
LPS students perform well on first online Math and English Language Arts CMAS tests
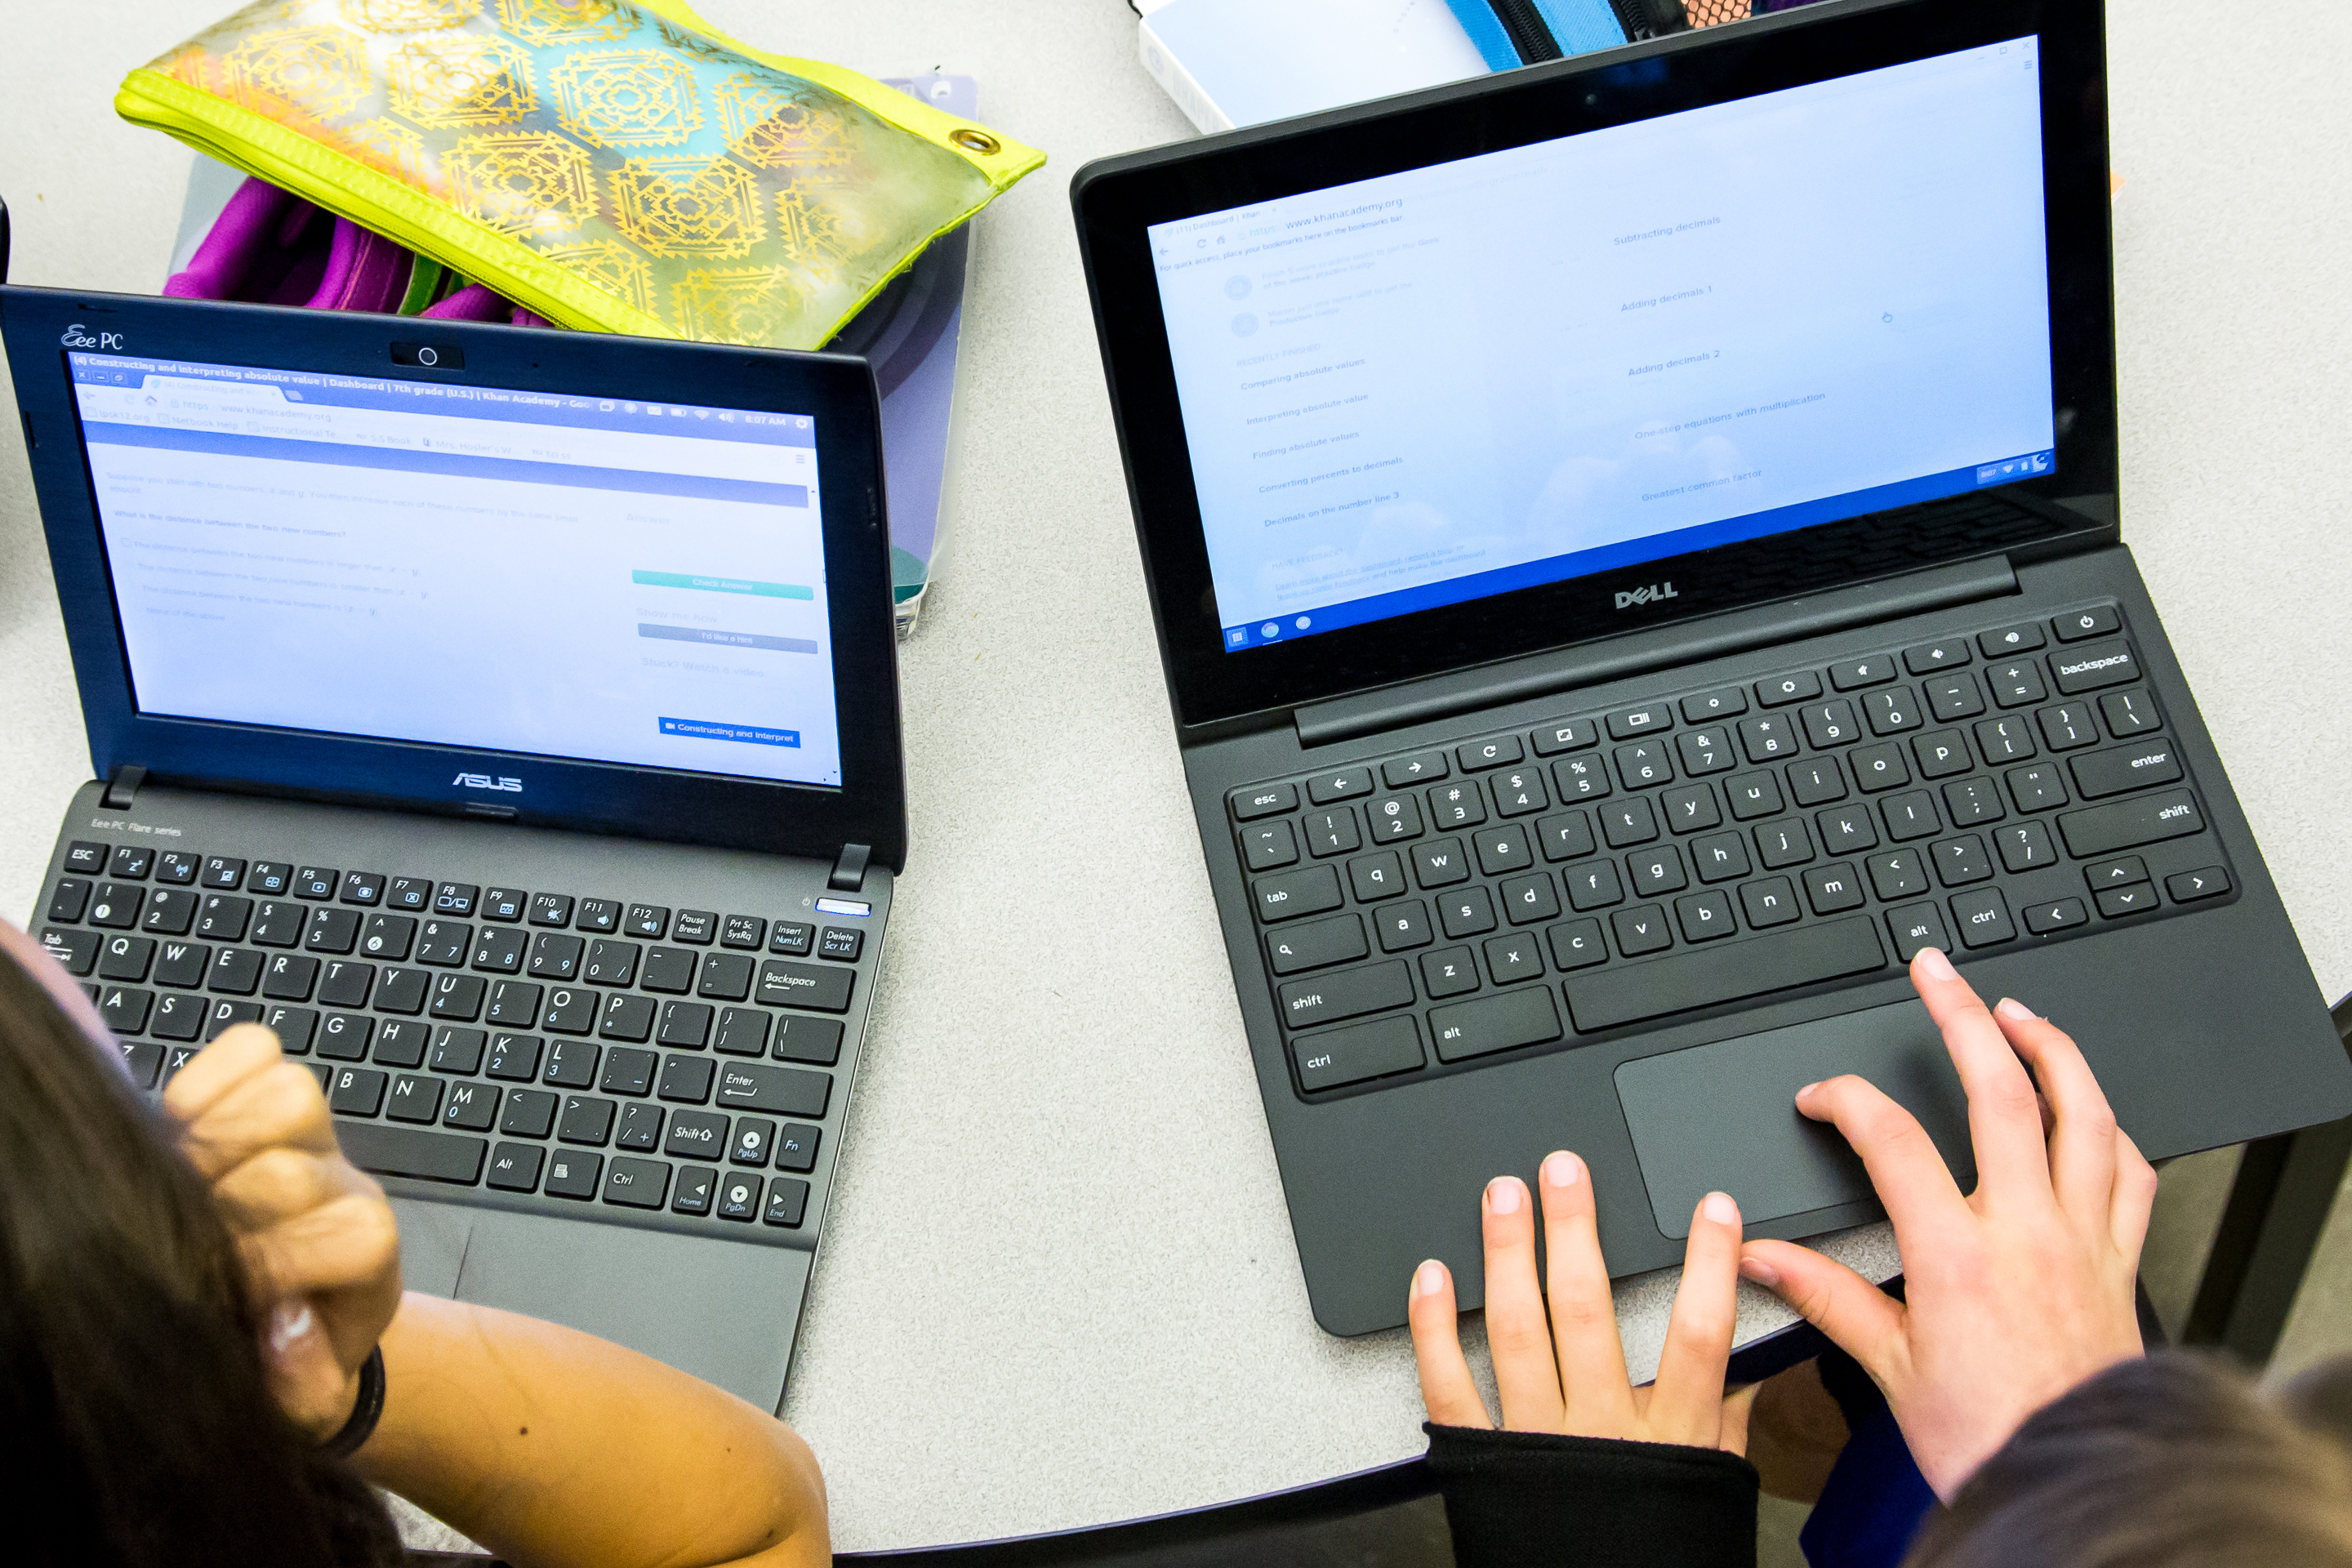
Littleton Public Schools students performed well on the first online math and English language arts state assessment tests, scoring significantly higher than the state average and the PARCC national average in all grades and subjects tested. The Colorado Measures of Academic Success (CMAS) test assesses grades 3 through 11 in math and English language arts. These tests were given for the first time statewide last April. These are our first online state assessments in math and English language arts. They replace the former state assessments, Transitional Colorado Assessment Program (TCAP).
Colorado’s state assessments recently changed in order to accurately assess student mastery of the updated Colorado Academic Standards. With the standards being more focused, coherent and rigorous, assessments must adapt to align with the standards. These CMAS tests incorporate new English language arts and mathematics assessments developed by the Partnership for Assessment of Readiness for College and Careers (PARCC). It was required that all Colorado school districts give these new assessments beginning in the 2014-2015 school year. Scores are now delineated by English language arts and mathematics, and no longer by reading, writing and math.
The new English language arts assessment and the new math assessment measure a more complex set of skills including critical thinking, persuasive writing, and problem solving using tools not available with paper and pencil tests. The expectation is that the online version of the test mirrors instruction that takes place in the classroom.
The scoring categories are also different because they reflect the new rubric and different scoring designations. Instead of Unsatisfactory, Partially Proficient, Proficient, and Advanced, the designations are Did Not Meet Expectations, Partially Met Expectations, Approaching Expectations, Met Expectations, and Exceeded Expectations.
When a new test is introduced, a new baseline is set and the expectation is that scores will drop considerably because there are new standards being assessed and there is a new testing environment—online instead of paper/pencil. As was expected, LPS scores are significantly lower than in the past. This drop in scores is reflected across the country where the PARCC test has been administered. This does not mean that LPS students are learning less or that the schools are doing a poor job of educating students. The former Transition Colorado Academic Performance (TCAP) tests were based on the previous Colorado Model Content Standards and were far less rigorous than the new CMAS/PARCC tests, which are based on the new Colorado Academic Standards (CAS).
Comparing the two sets of standards and the two assessments that are designed to measure them are like comparing apples and oranges. They are two totally different types of tests and a comparison is not valid. The new standards were developed by Colorado educators along with content specialists and assessment experts and are designed to make sure all students are on the path to college and career readiness.
Because this is the first year of a significantly different test, growth data will not be available until after the 2016 tests are administered and scored. This is also the first time that Colorado is taking a multi-state test. The PARCC Consortia is made up of 5 million students in 11 states, including Colorado and the District of Columbia.
According to LPS director of learning services Patti Turner, this transition year provides Colorado with a new baseline set of scores that will inform instruction as we move forward. LPS deputy superintendent Connie Bouwman agrees. “Based on the increased rigor of the Colorado Academic Standards, our district-level scores are aligned with our expectations. Overall, we are pleased. While these scores are certainly not where we ultimately want them to be, they show significant promise,” said Bouwman. “We see areas where the standards are clearly understood with instructional strategies in place. We also see areas we need to focus on to better support teachers as they work with the new standards and develop instructional strategies that will help our students be successful. Our teachers’ continued commitment to excellence is second to none.”
Highlights of district-level scores include:
- LPS significantly outscored the state and the PARCC Consortium in all subject areas and grade levels tested.
- LPS had significantly fewer students score in the category, “did not meet expectations” than did both the state and the PARCC Consortium.
- On average, LPS has 50% fewer students in the “Does not Meet” category than does the state for English language arts in grades 3-7.
- On average, LPS has 50% fewer students in the “Does not Meet” category than does the state for math in grades 3-7.
- In English Language Arts at the elementary and middle level, 10 percent or more LPS students scored in the “meets or exceeds” categories than did students at the state or PARCC Consortium level.
- In Math in all but one of the grades tested, 10 percent or more LPS students scored in the “meets or exceeds” categories than did students at the state or PARCC Consortium levels. At 8th grade, 7.3% more LPS 8th graders scored in the “meets or exceeds” categories than did students at the state or PARCC Consortium levels.
- In Algebra I, 21 percent more LPS students scored in the “meets or exceeds” categories than the state and PARCC Consortium.
- 246 LPS 8th grade students took the Algebra I test and 98% of those students met or exceeded the standard.
- 8th grade students had instruction in all middle school state standards prior to and including algebra I standards.
- 73 LPS 7th grade students took the Algebra I test and 96% of those students met or exceeded the standard.
- 71 LPS 8th grade students took the geometry test and 90% of those students met or exceeded the standard.
- 11 of 15 LPS elementary schools scored above the state in English language arts at all grades tested.
- 8 out 15 LPS elementary schools scored above the state in Math at all grades tested.
Highlights of school-level scores include:
- Franklin, Highland, Hopkins, Lenski, Runyon, Sandburg, Twain, and Wilder elementary schools all scored above the state in all tested grades in math.
- Centennial, Franklin, Highland, Hopkins, Lenski, Peabody, Runyon, Sandburg, Twain, Wilder, and Littleton Academy elementary schools all scored above the state in all tested grades in English language arts.
- Euclid, Powell, Goddard, Littleton Academy, and Newton middle schools scored above the state in English language arts in all grade levels tested.
- Powell, Goddard, and Newton middle schools scored above the state in math in all grade levels tested
- Arapahoe and Heritage high schools scored above the state in all tested grades in English language arts.
- Arapahoe and Heritage high schools exceeded the state in Algebra II and Geometry.
Non participation was a factor in LPS and was greatest at the high school level. At the elementary level, 3% of students in grades 3 through 5 did not participate in the assessment. At the middle school level, 15% of students did not participate. At the high school level, 60% of students grades 9 through 11 did not participate in the assessment, which means that high school scores represent only 40% of LPS students in grades 9 through 11. This limits our teachers’ ability to make instructional decisions and student placements in intervention or accelerated programs. Non participation also limits the ability of school and district leaders to judge the effectiveness of instructional programs.